
With one paper published today, we published a series of 4 papers on the epidemiology of the pandemic examining what everyone has been generally believing. There are some expected but many surprising outcomes. This is what the four papers summarily say
- Much before vaccines came in, the virus had already started losing its virulence rapidly, that continued despite some temporary hick ups. Today it is not much different than flue or common cold. After examining several alternative reasons for this trend we showed that largely evolution of the virus has led to loss of virulence. Vaccines played only a marginal role in this.
- Lockdowns and other restrictions were not at all effective in controlling the rate of transmission in the long run.
- Small increments in immunity because of subclinical infections and exposure to frequent but small doses of the virus played a major role in shaping the epidemics. All waves were substantially dwarfed than what all models predicted. This was not because of lockdowns, it was because of the small immunity increments conferred by the frequent small exposures. Carefully comparing the testable predictions of the two possible causes unanimously support the small immunity effects model and reject the lockdown model.
- The repeated waves were not caused by new variants as most commonly believed. Forget about causation, there is not even statistically significant association of new variants with new waves. The repeated surges were caused by rapidly declining immunity. At times a new variant successfully rode an upcoming wave. It was a consequence, not the cause.
- The succession of variants was not mutation limited. The pattern shows clear signs of selection limited evolution.
Links to the four publications showing the above are here
https://peerj.com/articles/11150/
https://www.currentscience.ac.in/Volumes/122/09/1081.pdf
https://doi.org/10.32388/LLA6AO
https://link.springer.com/article/10.1007/s12038-023-00382-y
In addition to the published work, there was more analysis and more inferences that remained unpublished, but some of them were presented in a couple of meetings. There is much more in the data that can be explored with new questions. This can be good exercise for students learning public health or statistics or simply learning science. I will illustrate this with a couple of examples below.
The graph shows the appearance and invasion by successive variants in UK, each variant in the proportion of samples sequenced being shown by a different color. The lower half shows the incidence surges, on a date matched scale. By the fundamental principles of statistics one should start with the null hypothesis that emergence of a new variant and the waves of transmission are independent of each other. Because there are so many variants coming up, a new wave may coincide with some upcoming variant by chance alone. Unless this null hypothesis is rejected, one cannot conclude that a wave is associated with a particular variant. This can be done for all countries where there is sufficient variant data. Believe me, this exercise has never been done in published literature. The conclusion that new variants cause a wave was reached just like that, without the minimum required statistical analysis. This is still untapped and open to be analyzed by someone.

Figure 1: The succession of variants each shown in a different color and successive waves of epidemic. What null hypothesis will be appropriate to show significant association of a wave with a variant?
See another example. Was the vaccine responsible for making the infection mild? This question is difficult to answer because of natural immunity being the confounding factor. But Australia and New Zealand offer an opportunity. After an initial surge, these two island countries were successful in keeping free of infection for almost a whole year. Then the infection re-entered and spread widely. But by this time vaccines had reached. About 80 % population got vaccinated and saturated there for multiple reasons. It did not climb to 100%. The mortality in the first wave of March to Sept 2020 was 30 to 35 times higher than that during Aug to March 2022. Because there was practically no natural infection for about one year and immunity is now known to be short lived, we can assume little natural immunity in this population at the beginning of the second wave. Did vaccine cause the 30-35 fold difference? This is impossible because only 80% population was vaccinated. If we go by a limiting assumption 1 (model 1 in the figure) that vaccination completely eliminated mortality in the vaccinated but did not prevent infection, then only a 5 fold difference is expected because 1/5th population remained unvaccinated. The remaining 6-7 fold is not explained by vaccine. If we make the other extreme limiting assumption (Model 2) that the vaccine prevented infection with 100 % efficiency and only the unvaccinated got infected in the second wave, then mortality among the infected shouldn’t have reduced at all, if vaccine was the cause of decreased mortality. The reality should lie somewhere between the two limiting assumptions. This means vaccines explain somewhere between zero and 5 fold difference out of the 30-35 fold difference.
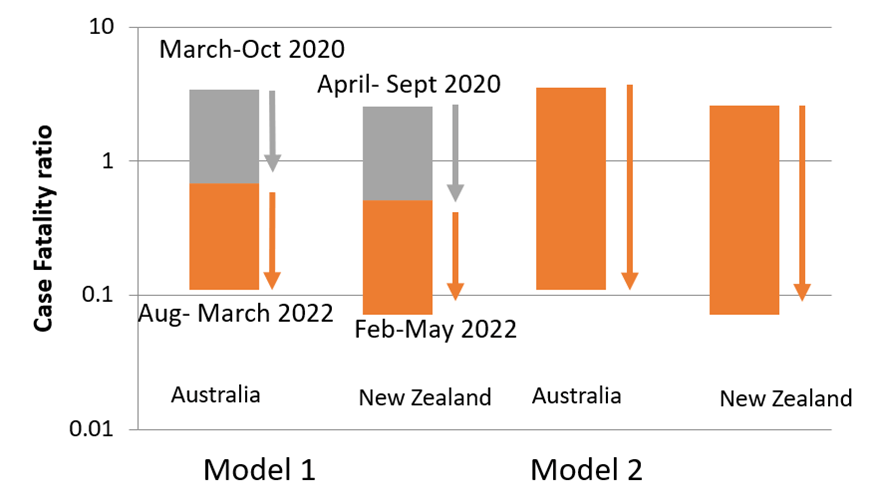
Figure 2: The difference between CFR in the first wave and second wave on a log scale. Gray represents the maximum difference explained by vaccines in models 1 and 2 respectively. The rest is likely to be explained by virus evolution.
I wonder why nobody sees such patterns, nobody challenges the religious like beliefs in the field of public health. This must be because we never teach science as a way to test, examine or challenge a hypothesis. We teach science as a religion.
There are more questions that can be asked with the available data and anyone can do this. I recently announced on my social media accounts that I would welcome any one to join me in addressing many such questions. No qualification requirements other than genuine interest. I received an amazing response. So much that I have to rethink about how to handle this. But I am sure, if I can motivate at least a handful of them so much useful science can be done and so many beliefs re-examined, not only in the pandemic data but in so many other problems of the society that need attention.
