
Last month I posted my hypothesis that the virus responsible for the pandemic is evolving rapidly towards a less virulent virus. I was astonished that it became “viral”. My blog has a limited niche readership which usually counts only to a few hundreds. But last time the original blog post had a readership of over a quarter of a million, which does not include sharing on other social media.
I received a large number of responses and it was impossible to respond to all, so I thought I will wait for more data and return with updates along with my rebuttal to the responses. While most of the responses were positive and appreciative, there was some trolling as well, which I enjoyed. What I consider most important are the responses raising certain issues. There were two main lines of arguments
(i) The death rates are not actually declining, the data or the analysis is fallacious. This might be either because (a) if the rate at which new infections appear is increasing and death happens after a time lag, the ratio of new Covid deaths to new infections would seem to have decreased but that does not mean death rate has decreased (b) the Indian data in which I showed a decreasing death rate are not reliable (c) the number of positives have increased because of more testing and so the death rate only appears to have decreased.
(ii) If the death rates are really coming down it might be owing to better medical care being available, not due to reduced virulence.
Fair enough. Respectfully I studied all the above possibilities and now I am giving more data from more reliable sources, with better analysis, and due consideration to alternative interpretations, all of which together shows that Covid has indeed become much milder throughout the globe. With this rate there is no doubt that it will be just like any other seasonal flue in a few weeks to few months. Moreover this trend is not explained by anything else but evolution of the virus towards reduced virulence.
Before we look at the data, let me add some clarification about the meaning of the ratios that we will use. In an on-going epidemic, the true death rate is difficult to calculate. I used last time and will continue to use below the ratio of the number of confirmed deaths in a day and the number of new cases detected on that day. The term case fatality ratio is commonly used for the ratio over cumulative data. I am using daily data so I will use a new term ND/NC for the ratio of the daily new Covid deaths by the daily new positive cases. I will use one more ratio here, ND/NR that is the ratio of number of deaths in a day to the number of cases declared as recovered on that day. The two indices reflect death rate, no doubt, but they are also affected by a few other factors.
One gift of the pandemic is that almost everyone has by now heard of R or R0, the rate at which the infection spreads. There is most often some time gap between the day of diagnosis and day of death. There is a larger time gap till a person can be declared recovered. Because of the time gaps, in a growing epidemic with R > 1, the ND/NC ratio is less than the death rate and the ND/NR is greater than the death rate. With a downward curve or R < 1, it is the reverse. In either case, the true death rate lies between the two ratios. As long as R remains the same both the ratios are directly proportional to the death rate. So a time trend in either of the ratios reflects time trend in the death rate. If death rate is constant, the ratios remain constant. However, if R changes, the relationship changes transiently. Only if R keeps on changing with time, the two ratios show a time trend even when death rate is constant. If R is decreasing continuously ND/NC ratio will show an increasing trend but ND/NR will show a decreasing trend even when the true death rate is constant. If R is increasing continuously with time, ND/NC ratio will show a decreasing trend but ND/NR will show an increasing trend. If on the other hand death rate itself is changing, then both ND/NC and ND/NR will show a time trend in the same direction. So if both the ratios are decreasing it is sure sign of death rate decreasing, but if one has a decreasing and other has increasing trend, it is because of a changing R. Thus the use of two ratios instead of one gives us greater insights into what is causing an observed time trend.
Almost throughout the globe the R value for Covid 19 has been decreasing with time. In other words the days required for doubling have been increasing. So if the death rate was constant, we should have seen an increasing ND/NC ratio. It does show an increase in some countries like Canada that have achieved an accelerated downward epidemic curve. This does not necessarily mean the death rate increased in those countries. But if ND/NC is decreasing in spite of reducing R, then it is almost certain that death rate is decreasing. This is the picture in global data pooled over all the countries. Globally we see that both ND/NC and ND/NR are consistently decreasing since mid April. One more important global pattern is that the proportion of active cases needing critical care has also been decreasing.

One of the objections to my analysis last time was that data are not reliable in many countries either due to lack of transparency such as that suspected in China or data mismanagement that we have witnessed in India recently. But we can always look at data from countries which are democratic and whose data transparency has not been questioned. Illustrated here are patterns from a few representative countries showing increasing, stable or declining infected populations.

Most notable is Sweden, a country which did not forcibly impose lockdown. Although Sweden witnessed a high rate of infection along with high death rate initially, the decrease in ND/NC has been one of the steepest in Sweden. Germany has both downward curve as well as decreasing ND/NC ratio which is a sure shot indicator of decreasing death rate.
India needs a particular mention since last time I illustrated it as an example case of decreasing ND/NC. The decrease that time was very steep and if that rate continued, it appeard that by first week of July it will become just another flu, in terms of its mortality rate. I also said that I suspect the slope will not remain the same. In reality the ND/NC for India increased significantly between 26th May and 11th June and then started declining again. There is an interesting possible reason for the abrupt rise. In India and Maharashtra in particular, from where the largest chunk of deaths come, the infection curve took a very strange turn by the end of May. This was the time when lockdown was lifted and everyone feared that the already upward infection curve will become extremely sharp. But instead it suddenly became flatter, remained flat for quite some time and then increased, but much slower than expected. Which means R underwent a dramatic drop, which is expected to increase ND/NC ratio transiently. That seems to have happened. But ND/NR kept on declining monotonically suggesting that the death rate continued to decrease.
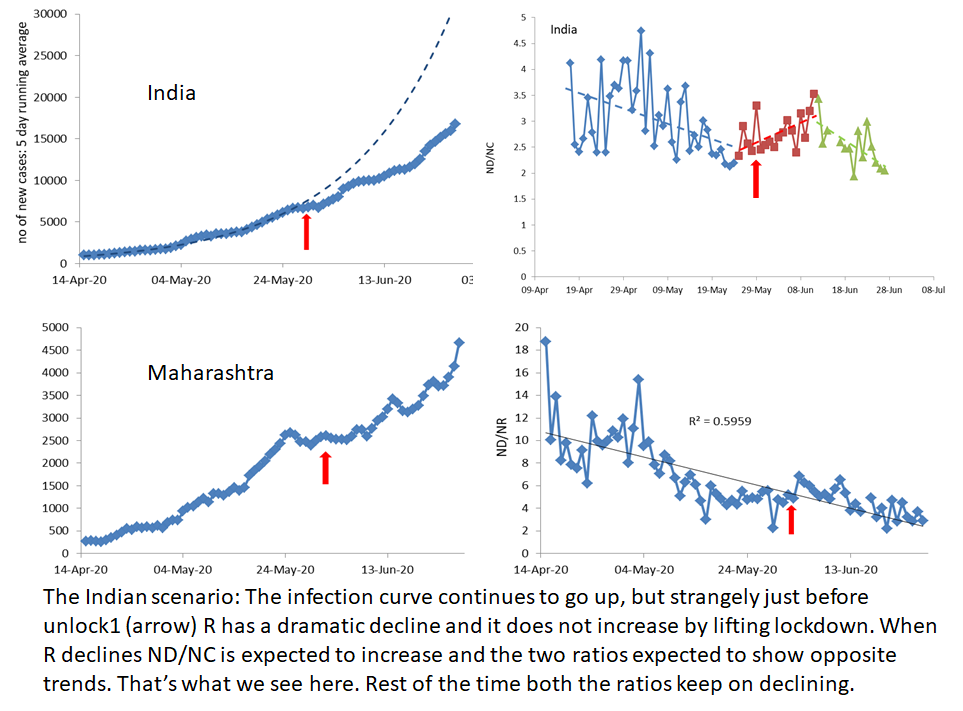
There are problems with the Indian data. By mid June, over 1500 deaths that were declared as non-covid deaths earlier were reclassified as Covid deaths but then they were added to the data not on the day of death but on the day the classification was changed. As a result the time trend is completely messed up. If one tries to correct for this bias, the number of deaths on the left will have to go up by an average 14%. If such a correction is made, both the ratios will decrease more sharply. So although the data are messed up, there are reasons to believe that even in India the death rate has been going down.
What is surprising is that on lifting the lockdown, the curve did not go up more sharply. It actually flattened a little. Most people tend to give the credit for flattening any curve to the quarantine, social distancing, sanitization and other preventive measures. Here you see the reverse. When people’s movement, transport, crowding etc. increased and preventive measures relaxed, R decreased further. If it was not because of better preventive measures, what could be the alternative cause? The proportion of infected individuals is still a tiny fraction of the population, so herd immunity is unlikely to have played any role. Again I suspect, the virus itself had changed by the time the lockdown was lifted.
Can the apparent decrease in ND/NC be just because of increased testing so that we are detecting more of the asymptomatic cases? I have two responses to this. One is to look at whether the testing has disproportionately increased. In India, they started with testing the contacts of known positives and the high risk groups. As the number of positives increase, this number of tests is expected to increase more or less proportionate to the number of positives. If testing had really expanded to go beyond and sample random individuals from the general population, the ratio of number tested and number positive should change substantially. Also since the proportion of positives in the general population is expected to be less than the contacts of known positives, an effort to expand sampling will inevitably result into a decrease in the proportion of positives. Using this indicator we do not see any evidence of testing having increased, because the proportion of positives has marginally increased instead of decreasing.
But even if we assume that the testing has really expanded and we are finding more asymptomatic cases and that is the reason why the ND/NC ratio is coming down, the question remains, from where did so many asymptomatic cases come up? Either they were there in the same proportion right from the beginning or they increased recently. The former means that the death rate was never high. The virus was never as dangerous as we were made to believe. Whether intentionally or not, people have been fooled about the threat of the virus all the time! If we take the latter possibility, if so many asymptomatic cases have come up suddenly, that itself is evidence that the virus is losing virulence and most of its infections do not even make you feel sick.
What if the death rate is truly decreasing, but that is only because better medical facilities are available. This sounds logical but the data look strange. Across countries, the ones with poor infrastructure and absence of good medical care have much lower death rates than developed countries that always had excellent health care. So associating good medical care with lower date rate has problems. There is no effective drug available as yet that would make a large difference. Even the promising clinical trials so far have marginal effect sizes. So how far treatment can change the death rate in the current situation is doubtful. You may say that the high death rate in developed countries is due to having greater proportion of elderly in the society. This is the factor that explains why there is high death rate here. But when the death rate in these countries reduced from over 10 % to less than 3 %, did the proportion of elderly changed this much? Or did any new treatment suddenly became available that made this difference? There is no way treatment can explain the reducing death rates. Even more convincing is the trend in the proportion of patients requiring critical care. That itself has come down substantially. So evolution of the virus to lower virulence is the only sensible explanation for it.
If the virus is really losing virulence, how far are we from calling it just another flu virus. The answer to this question might be different in different countries. Since there is little transmission across countries currently, virus evolution may have taken different speeds in different areas. Globally the proportion of patients requiring critical care has come down and at present, only 1.4 % of active cases are on critical care. Not all of them will die. This means over the next week or two the ND/NR ratio would have come down below 1 %. For seasonal flu the death rate ranges from 0.1 % downwards. Which means Covid is rapidly approaching the status of any ordinary flu.
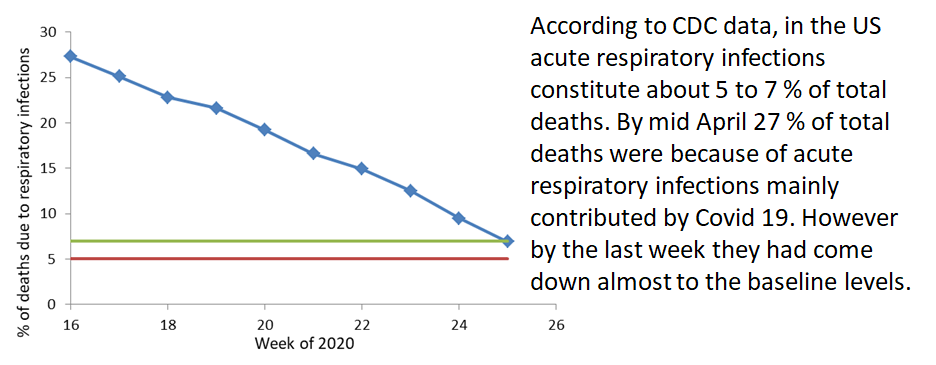
Another indication comes from CDC data on the causes of death in the US. Influenza-pneumonia together cause 5-7% of total deaths in the US. By mid April, this had gone up to 27% mainly due to Covid. Last week it was back to 6.9 % again which is hardly different from the baseline. CDC report says that last week’s proportion may be somewhat underestimate so do not consider the basal level to be back as yet. But the trend shows that it is almost back.
In India, the average deaths per day are of the order of 50,000 and on an average about 6 % are due to respiratory infections. So the daily respiratory deaths are of the order of 3000. Covid daily deaths are of the order of 300 to 500 per day currently. So we are about 15 % above the average in terms of death. This will increase transiently since the number of new infections is still going up. But with both R and ND/NR ratio decreasing, the number of deaths are unlikely to approach what many mathematical models had predicted earlier. So although we still have time to call Covid just another flu, we are certainly going in that direction.
Now, a million dollar question. If the data are so clear, why is nobody talking about reducing threat from the virus?
I can perceive many reasons. One is a genuine worry that if we say so, people will become even more irresponsible. But this is happening all over the world anyway. There are two possible ways in which people will act in near future. One is that they realize that the virus is much less of a threat than what we believed earlier, so there is no need to worry, but it’s good to be cautious not for one’s own safety but for the elderly and weaker ones. So some responsibilities and care need to continue. The other possible way is that they stop believing in WHO and other health authorities and choose their own ways to go about. The first is obviously more preferable and that will happen if the authorities accept reality, change the policies, take people in confidence and tell them why they need not worry now but still need to be responsible in certain ways. It is also important to be prepared for a second wave if any, or may even be a new virus. So we need to learn from experience and chalk out long term policies. If the authorities do not take such a clear stand and continue to play ostrich, people are bound to choose the other way, the signs of which are already seen in all parts of the world.
There are more reasons why scientists won’t talk about the obvious time trends. Admitting that the virus is milder now is equivalent to losing huge funding opportunities. Huge amount of investment has been made in vaccine and drug development. This I would say is valuable as a back-up. In case the trend changes or there is a second wave we need to be prepared for the worst. But that is not the way it is going. It is going as a big business plan. People in this business will be most reluctant to accept that the virus is becoming milder. So partly for genuine reasons and partly for business scientists and health authorities will refrain from accepting reality.
But common man should. All data are in the public domain. Anyone can look at the original data and ask his/her own questions rather than getting fooled authorities, by media and fall prey to Zohnerism.
Open data sources used for this article:
https://www.worldometers.info/coronavirus/
https://www.worldometers.info/coronavirus/worldwide-graphs/
https://www.who.int/emergencies/diseases/novel-coronavirus-2019/situation-reports
https://ourworldindata.org/mortality-risk-covid
https://www.cdc.gov/coronavirus/2019-ncov/covid-data/covidview/06262020/nchs-mortality-report.html
