This virus does not seem to stop giving surprises. So far so many predictions from people of science, including some of mine, have failed. I did not think, for example, that the second wave will be so sudden and large, although CFR has kept on dropping as I predicted. Even amidst the oxygen crisis and other problems with the patient care system, CFR in this wave is much smaller than last wave. But the total deaths are much greater than expected simply because the transmission has been just too rapid.
But what caused this rapid transmission? Everyone seems to blame the election rallies, the madness called Kumbh and elsewhere normalizing life, traffic, transport and travel. While I feel normalizing life is inevitable and must happen, I won’t count a religious gathering of that scale or election rallies as a necessary part of normal life. If examinations also were postponed, why not elections? If at all elections were necessary, why not restrict campaigns to TV, radio, mobile and other media? These have reached every corner of India. It was too obvious a conclusion for everyone that crowding during election rallies and the Kumbh has caused the terrific surge.
However, as a science teacher, I am not content with simple looking logic, opinions and consensus. I wanted to look at data. Particularly when I see so many people convinced about something without giving actual data, I become restless and I want to see the data myself. So I tried to assess how much is the contribution of Kumbh and election rallies to the second wave.
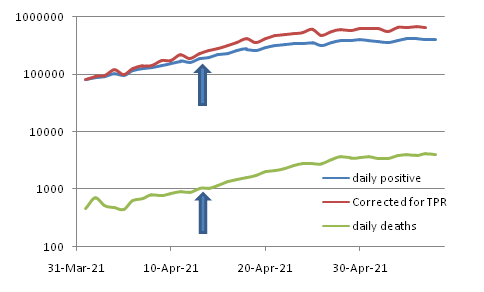
The surprising results are here. The peak of Kumbh crowd was on 14th April and a couple of adjoining days. If there was a large scale viral transmission during this crowding, people would have disperse back to their homes throughout the country, then after a few days of incubation, they would be sick, and eventually will spread the virus further around. We will see a nation-wide rise over and above the background rate of spread. So the slope of the curve would increase significantly a week or two following Kumbh. But we just don’t see any trace of this. The slope does not increase, in fact it decreases a bit.
At this time, it is likely that testing facility is also saturating, so not everyone gets tested. The cases could be an underestimate. When testing facility becomes limiting, only individuals with symptoms are given preference. So a large number of asymptomatic and mild cases escape detection. This is reflected in an increase in the test positivity rate. There have been various estimates of proportion of asymptomatic cases. I took the largest estimate of 80% positives being asymptomatic. Therefore behind every rise in TPR there should be 4 fold more rise in undetected cases. The data can be corrected for this possibility. Even after making this correction, we do not see any increase in the slope following Kumbh and a reasonable time lag. This means that Kumbh had a negligible effect on incidence on a nation wide scale. One can always argue that if Kumbh wasn’t there the curve would have come down more quickly. This is an untestable statement. You can’t give evidence either way. We can say at the minimum that Kumbh did not seem to have increased the pre-existing rate of transmission.
The case with election rallies is a little different. It somewhat coincides with the beginning of the second wave. But if you allow for the lag due to incubation period, the wave would have begun prior to election campaigns but only marginally, which we can ignore. But here we have another means of comparison. Only five states had elections. So we can directly compare the transmission between states with and without elections. That’s what you see in the second graph. The states with election fall within the range of states without elections. Their transmission rates are in no way greater than states without elections.

So I won’t blame the Kumbh and elections solely for the wildfire of transmission. They had a negligible role seen in data even after correction for biases. So we have to look for alternative causes for it.
Perhaps this is not so surprising because I showed in a previous blog (https://milindwatve.in/2021/02/21/covid-19-did-lockdown-work/) that during the downward phase of the wave, even the Bihar elections and Farmers’ agitation did not affect the downward trend in any way. These patterns, combined with our prior finding (https://www.preprints.org/manuscript/202104.0286/v1 ) that globally, preventive restrictions have only marginally affected the slopes of the curves, provokes a serious rethinking of all that we were told about transmission. It is also being realized that longer distance airborne spread of this virus is much more common than what was believed earlier and that the chances of spread outdoors are considerably smaller than indoors (https://www.nytimes.com/2021/05/07/opinion/coronavirus-airborne-transmission.html?fbclid=IwAR0sld85XEG1v_m-Pp-gVby6qvjBMa0Fst0ETxPS7448aNDb1fdXjwHoqeg ). All the crowding incidents that we are talking about here are under the open sky.
When there is a conflict between our beliefs and data, I prefer to go by data, keeping margins for its biases and inadequacies. Everyone doesn’t. They believe in data when it supports their beliefs. They say data not good when it doesn’t.
But the pandemic hasn’t ended. More surprises might be waiting for us and we should be prepared to see more data, test more, interpret more, learn and unlearn more. The virus, so far, seems to have evaded science in a big way. It’s better we take every definitive statement from health authorities with a pinch of salt.
