If I had continued to be in IISER, I would have retired by this month end. I decided to quit academia exactly four years ago and taking some time to wind up, my last day in a formal academic institute was 31st march 2019.
When I decided and declared my plan to quit academia, there were a wide variety of responses. I know that many would have felt happy but did not say that, at least to me. The responses that reached me were sad, surprised, shocked, disagreeing, pursuing me to change my mind, wishing for a better future and all. An old friend called and told me that I was committing suicide. I will have no future in science by quitting academics. Perhaps he, like many others, thought that science can survive only in academia. “Leaving academia is like killing oneself and one’s science.” he said. I could only reply “Let’s us experiment and see”. So my suicide was experimental. Now after almost 4 years of the continued experiment, I can ask myself, “Did I really commit suicide?” Was it an end of my creative, active, productive years in science measured by any standard?
Let us begin with the stereotyped conventional standard measures, in spite of my repeatedly expressed view that these are useless and often counterproductive measures. That is, the number of publications, impact factors etc. In the less than four years of non-academic, non-career focused pursuit of science, I (and my loosely knit and highly dynamic team) published 17 papers, 5 more are in preprints and under review, revision or resubmission. Seventeen more are in various stages of development out of which 11 have been penned down partially (list of all the 34 at the end). Quite often new ideas come from interactions with students or others and they jump up to high priority. The 17 that currently fall in line might be bypassed by more novel and attractive concepts. My average outcome of papers in the last 4 years is slightly greater than my own average when in service. Recently I came across this article in Science (https://www.science.org/doi/10.1126/sciadv.abq7056) that gives the average output of a faculty in the US. My average output as a citizen outside mainstream academia is 2-3 fold greater than that. For those who believe in impact factors I published in fairly good impact journals including Behavioral and Brain Sciences, Conservation Biology, Evolution, Scientific Reports-Nature and PLOS One. The only limiting factor was author charges, which puts a limit on how many papers I can publish in such journals. In spite of this limit, going by conventional standards I did not perform lower than the faculty average anywhere in the world.
But not everything is captured by the conventional standards. What I value more is the range of subjects that I could explore, some of which was possible ONLY because I did NOT work in an Institute or did not identify myself with the mainstream academics. The mainstream has three major hurdles or limitations. One is the heavy peer pressure owing to which it is too tough to think out of the box and consider possibilities other than the current trends in the mainstream. I feel the difference since I have experienced working both within and out of the system. In my experience, being free from peer pressure opens up the mind far wide and encourages alternative ideas and visions. Even more important than that, I can afford to be more honest now. Being in the system it is extremely important to worry about political correctness and not to hurt your potential funders, editors and reviewers. I feel free now to expose and criticize whatever I see as wrong, unfair or unethical. An academic aspiring for a successful career needs to inculcate cowardice. Success is not possible without that.
The second limitation is the bureaucratic framework in which you need to fit all your research. The bureaucratic procedures are made for a certain type of, mainly lab oriented research. Other areas of research have different needs. The institutional structure is intended to support science and therefore should have sufficient flexibility to support different needs of different types of research. But in reality the institutions say, “This is our framework and it shall nor bend. You bend your science to fit in, otherwise fXXX XXX”. (That’s what I actually did when faced with such a situation.) Having no funding is often better than having funding already allotted to something. Research can take unexpected paths anytime and you need to change everything when it does so. A pre-budgeted funding doesn’t allow you to do so.
The third barrier is the formalism; only things done a certain way are called science. The same thing done or written in a slightly different format is not considered science. This package of limitations comes along with the institutional support, so the support itself becomes the prison. I clearly experienced that being out of the prison improved my thinking, opened up the skies, eliminated rituals and reduced the conflicts of interest, biases and prejudices typical of mainstream science.
Of course having no money in hand puts a different set of limitations. So for obvious reasons, the nature of my research changed. I have no lab to do any desk work now. But the fields and forests out there and the human society are two open labs of huge dimensions. You don’t need any committee pre-approvals, pre-registration or any formality to start working on anything. Developing concepts and making simple models addressing novel questions and exploring new ideas does not need money. In addition, in today’s science huge amount of data are lying in the public domain largely unused and un-interpreted or more often misinterpreted. Most institutional scientists are data generators, not insight generators. Generating useful insights from already available data also does not need any funding. Anyone outside the academia can certainly do more insightful science using data generated by the academic labor contractors.
There is a neo-brahminical notion in the mainstream that only whatever is published in peer reviewed journals is science. This notion persists in spite of so many studies and experiments showing the flaws, biases, power play and academic racism in the peer review system. The science under the open sky is free of such flaws. I continued to publish in peer reviewed journals at times because the short sighted academics won’t understand the science outside. But now I also write original research findings directly for laypeople. In the last 4 years I wrote three science books in Marathi and 6 more book concepts are developing. These books are not only science simplified in local languages. It has novel research outputs and novel concepts being discussed for the first time anywhere. I have lost count of articles I wrote in news papers and magazines.
Why publish in Marathi? For the simple reason that the kind of science I do can be better expressed in people’s language. A language comes with its own set of ideas, imaginations, fantasies and metaphors not necessarily shared by other languages. Fantasies are important for science, as exemplified by the August Kekule’s story about the origin of the concept of cyclic compounds. I have myself used very carefully concepts from Indian mythology in churning out novel interpretations of experimental data. Diversity of cultures, languages, mythologies will enrich the input of ideas in science further. So it makes sense to do original science in different languages. I am using Marathi more frequently now. It may eventually get translated in English if and when anyone wants them in that language.
Whom did I work with? One person can hardly do anything. Team work is essential. Obviously I had no PhD students registering with me anymore. I am no more teaching any undergrad courses. But somehow a few undergraduate students as well as PhD students registered with someone else kept on coming to me to enjoy working together. The advantage now is that they come from multiple colleges and institutions. My former co-workers continued to be with me independent of their jobs. I also worked with social workers, NGOs, farmers and tribesmen; having no formal training in science; some being illiterate or marginally literate and they have been my co-authors in papers published in prestigious journals too. Being illiterate should not prevent one from being a productive researcher and I could demonstrate this happening in reality. This would have been impossible in an institutional framework that relies on paper qualifications rather than the inner capabilities and drives of a candidate while recruiting research personnel. So I presume there will not be dearth of co-workers in pursuing science outside academia. In fact you get better personnel outside because there is no formal qualification requirement.
I am not writing this as a self appraisal. A self appraisal was necessary as a part of the academic routine in IISER, which I hated like most others. So why should I do it now when there is no compulsion. I am not writing this to say how great I am. I am not; I only followed a different path. It’s only meant to demonstrate that good quality science can be done outside mainstream academia. I will urge science personnel more talented than me to try out this model of doing science. I am sure there are more capable researchers than myself and they can make this model even more productive. The monopoly of academia needs to be broken. I don’t mean that we wind up all Universities and Institutions but we need to take active research beyond the bounds of academia and we should see more of common people contributing to important and novel areas of science that the academia just cannot reach.
In academia, we see a trend in the reverse direction. Scientific misconduct, reproducibility crisis, race- gender and other discriminations, peer review biases, embarrassingly growing retractions, stress-anxiety-suicide in students are increasingly coming to light. No sound, effective and durable solutions to such problems are coming forward. This is mainly because of badly designed academic systems. Systems thinking is rare in the field although there is intensive research in systems thinking focused on fields other than academia. These researchers do not seem to be doing anything to mend their own house. Changing the academic systems seems too improbable in near future mainly because people in academics have never experienced alternative systems. So they remain short sighted. I see one effective way out. I have experimented on it and demonstrated that it works. Liberating science from academia is my solution. This is badly needed for ensuring a future of more inclusive, more open minded and less prejudiced healthy science.
Papers published after quitting formal academics:
I can say that in 7 out of the 17, my earlier time at IISER has some contribution.
- Shinde, S., Patwardhan, A. & Watve, M. (2022) The ratio versus difference optimization and its implications for optimality theory. Evolution, 76, 2272-2280. https://doi.org/10.1111/evo.14605
- Ojha, A., Watve, M. (2022). The predictive value of Kuhn’s anomaly and crisis: the case of type 2 diabetes. Academia Letters, Article 5494. https://doi.org/10.20935/AL5494.
- Watve M, Watve M. (2022) Tradition–invention dichotomy and optimization in the field of science. Behavioral and Brain Sciences Nov 10;45:e272. doi: 10.1017/S0140525X22001236.
- Kharate, R.; Watve, M. (2022) Covid 19: Did Preventive Restrictions Work? Curr Sci, 122, 1081-85.
- Vidwans Harshada, Kharate Rohini and Watve Milind (2021) Probability ratio or difference: How do people perceive risk? Resonance, 26, 1559-1565.
- Ulfat Baig et al (2021) Phylogenetic diversity and activity screening of cultivable actinobacteria isolated from marine sponges and associated environments from the western coast of India. Access Microbiology, 2021;3:000242. DOI 10.1099/acmi.0.000242.
- Shinde S, Ranade P, Watve M. (2021). Evaluating alternative hypotheses to explain the downward trend in the indices of the COVID-19 pandemic death rate. PeerJ 9:e11150 DOI 10.7717/peerj.11150.
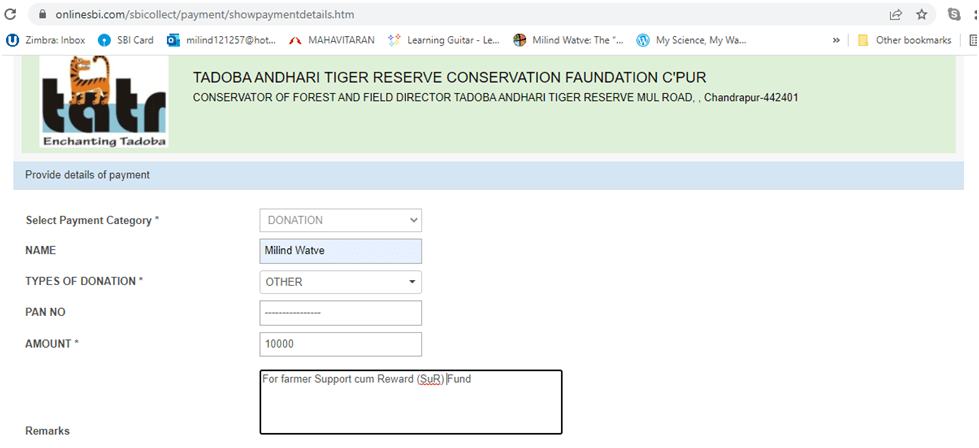
- Poorva Joshi, Neelesh Dahanukar, Shankar Bharade, Vijay Dethe, Smita Dethe, Neha Bhandare and Milind Watve. (2021) Combining payment for crop damages and reward for productivity to address wildlife conflict. Conservation Biology, 2021, 1- https://doi.org/10.1111/cobi.13746. (This paper became the Editor’s pick for Conserv. Biol. Dec 2021 issue). This work also received an award from Society for Conservation Biology.
- Patil P, Lalwani P, Vidwans H, Kulkarni S, Bais D, Diwekar-Joshi M, et al. (2021) A multidimensional functional fitness score has a stronger association with type 2 diabetes than obesity parameters in cross sectional data. PLoS ONE 16(2): e0245093. https://doi.org/10.1371/ journal.pone.0245093
- Diwekar-Joshi M, Watve M (2020) Driver versus navigator causation in biology: the case of insulin and fasting glucose. PeerJ 8:e10396 https://doi.org/10.7717/peerj.10396
11. Baig, U., Vidya Lakshmi., Ojha, A., & Watve, M. (2020). Geriatric infections: Decreased immunity or evolved opportunists?. Journal of biosciences, 45(1), 57. https://doi.org/10.1007/s12038-020-0025-x.
12. Vibishan B. and Milind Watve. (2020) Context-dependent selection as the keystone in somatic evolution of cancer. Nature Sci Rep,10, 4223.
13. Anagha Pund, Ketaki Holkar, Milind Watve and Ulfat Baig. (2020) Predator, prey and the third beneficiary. Matters 201911000003
14. Watve Milind and Ojas S. V. (2020) Difference, Division & Desi: How people’s innate intuitive economics decides the outcome of an operation. Economic and Political Weekly, Feb 22nd, Vol 8, 28-32.
- Ulfat Baig, Lavanya Lokhande, Poortata Lalwani, Suraj Chawla, Milind Watve (2019) Foraging theory and the propensity to be obese: an alternative to thrift. HOMO J.Comp Human Biol, 70(3), 193-216.
- Harshada Vidwans, Anagha Pund, Milind Watve (2019) The other side of Statistical significance, JAMA network https://jamanetwork.com/journals/jama/fullarticle/2730486
17. Watve M. (2020) Challenges to human nutrition research: shall we learn from history? Science, e-letters https://science.sciencemag.org/content/367/6484/1298/tab-e-letters
In preprints and under review/resubmission:
1. Srashti Bajpai and Milind Watve Evolution of new variants of SARS-Cov-2: mutation limited or selection limited? https://biorxiv.org/cgi/content/short/2022.09.22.509013v1
2. Akanksha Ojha, Harshada Vidwans, Milind Watve Does sugar control arrest complications in type 2 diabetes? Examining rigor in statistical and causal inference in clinical trials https://doi.org/10.1101/2022.08.02.22278347
- Watve M. G. and Bhisikar H. Epidemiology: Gray immunity models give qualitatively different predictions. https://www.preprints.org/manuscript/202109.0162/v1
- Milind Watve. The evolutionary psychology of scientific publishing: Cost-benefit optimization of players in the game. https://ecoevorxiv.org/nvpe2/
- Akankasha Ojha and Milind Watve. Hyperglycemia in type 2 diabetes: Physiological and clinical implications of a brain centered model. https://www.biorxiv.org/content/10.1101/2022.01.19.477014v1
Themes at various stages of development that are expected to make publishable papers in near future:
(The first 11 are already partly written down. There are non-academic co-authors for many of them)
- Somatic evolution of cancer: A new synthesis
- Fitness interventions are more effective than anti-hyperglycemic interventions in preventing diabetic complications: A comparative meta-analysis
- Virulence management: shaping natural selection on virus in ongoing epidemics.
- Need for ingenious behavior based systems design: learning from good and bad systems
- Principles of behavior based systems design
- A behavior based farmer policy for India
- Potential applications of Support cum Reward system in Agriculture.
- Multiple context specific models of cost-benefit optimization in human behavior
- Additive and multiplicative fitness components and multi level selection.
- Potential behavioral conflicts and possible mitigation in community forest rights and other community management programs
- The evolutionary psychology of scientific publishing: a behavior based system model for science publishing
- The evolutionary psychology of research: Optimization of innovation and appropriate design of an academic support system.
- Poor correlation between different components of functional fitness and the trend with age.
- Inferring causation from cross sectional correlations in non-equilibrium systems
- Optimizing flower sex ratio for maximizing pollination
- Heart versus head in decision making: Biological and cultural evolution of the perceived dichotomy.
- Issue based democracy versus leader/party based democracy: How to design a behavior based constitution for a democratic country.